Public Opinion Polling on the Covid-19 Vaccine
January 25, 2021
A Vector Poll™ case study
By Marc Zwelling and Adrian Macaulay of The Vector Poll™
Read the related article by Marc Zwelling of The Vector Poll™:
With Limited Vaccines, The Public Weighs Who's First (February, 2021)
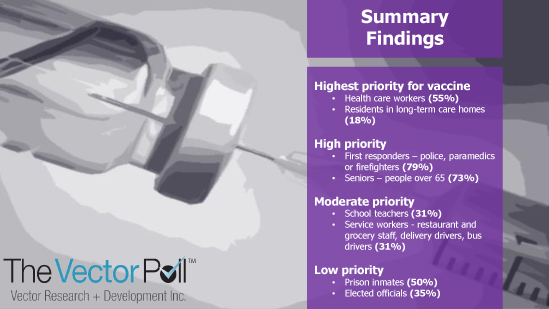
Summary Findings.
Question: Now that vaccines to protect people from getting Covid-19 are being approved, but are in limited supply, please indicate what priority you think each of the following groups should be given.
Click the image to view a larger version
Highest priority for vaccine
- Health care workers (55%)
- Residents in long-term care homes (18%)
High priority
- First responders – police, paramedics or firefighters (79%)
- Seniors – people over 65 (73%)
Moderate priority
- School teachers (31%)
- Service workers - restaurant and grocery staff, delivery drivers, bus drivers (31%)
Low priority for vaccine
- Prison inmates (50%)
- Elected officials (35%)
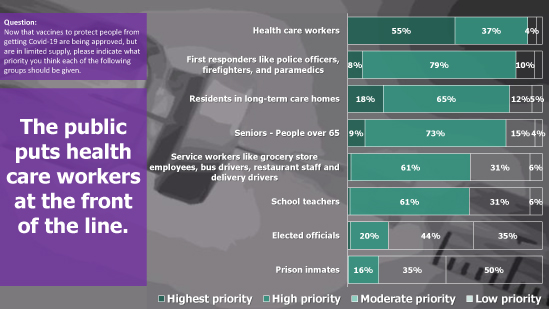
Who should be highest priority to receive the Covid-19 vaccine?
Click the image to view a larger version
The public puts health care workers at the front of the line.
Responses:
- Health care workers (55% - Highest priority)
- Residents in long-term care homes (18% - Highest priority)
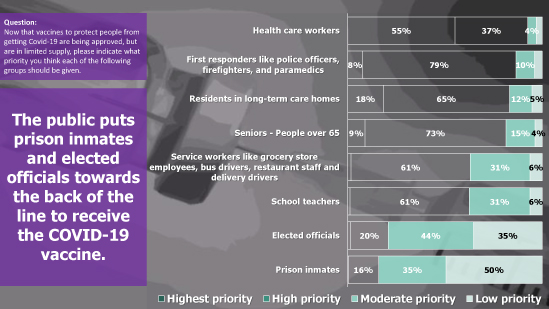
Who should be lowest priority to receive the Covid-19 vaccine?
Click the image to view a larger version
The public puts prison inmates and elected officials towards the back of the line to receive the Covid-19 vaccine.
Responses:
- Elected officials (35% - Low priority)
- Prison inmates (50% - Low priority)
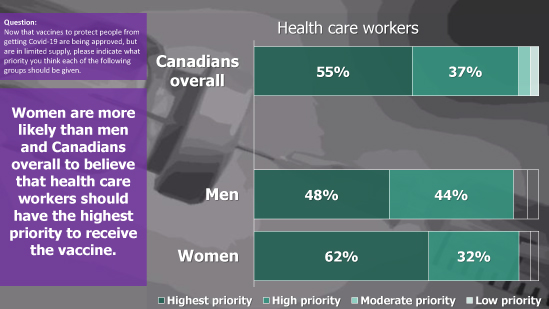
Health care workers
Click the image to view a larger version
Women are more likely than men and Canadians overall to believe that health care workers should have the highest priority to receive the vaccine.
Responses:
- Canadians overall (55% - High priority)
- Men (48% - High priority)
- Women (62% - High priority)
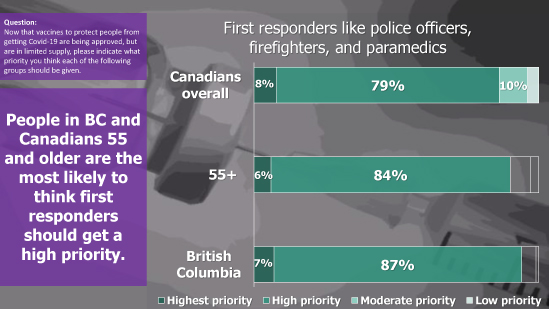
First responders like police officers, firefighters, and paramedics
Click the image to view a larger version
People in BC and Canadians 55 and older are the most likely to think first responders should get a high priority.
Responses
- Canadians overall (79% - High priority)
- Men (84% - High priority)
- Women (87% - High priority)
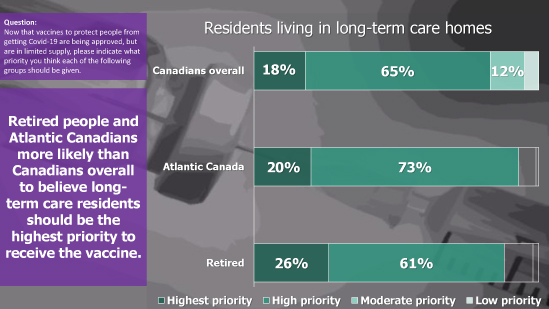
Residents living in long-term care homes
Click the image to view a larger version
Retired people and Atlantic Canadians more likely than Canadians overall to believe long- term care residents should be the highest priority to receive the vaccine.
Responses
- Canadians overall (18% - Highest priority)
- Atlantic Canada (20% - Highest priority)
- Retired (26% - Highest priority)
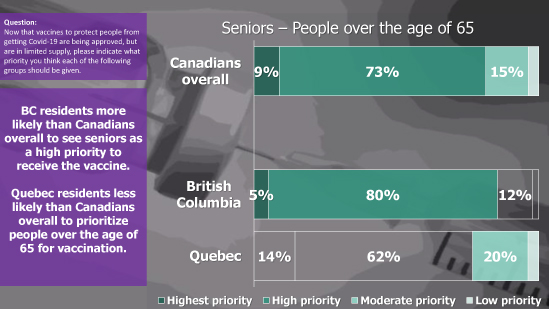
Seniors - People over the age of 65
Click the image to view a larger version
BC residents more likely than Canadians overall to see seniors as a high priority to receive the vaccine.
Quebec residents less likely than Canadians overall to prioritize people over the age of 65 for vaccination.
Responses
- Canadians overall (73% - High priority)
- British Columbia (80% - High priority)
- Quebec (20% - Moderate priority)
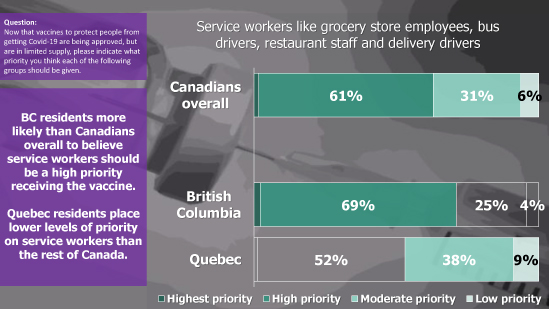
Service workers like grocery store employees, bus drivers, restaurant staff and delivery drivers
Click the image to view a larger version
BC residents more likely than Canadians overall to believe service workers should be a high priority receiving the vaccine.
Quebec residents place lower levels of priority on service workers than the rest of Canada.
Responses
- Canadians overall (61% - High priority)
- British Columbia (69% - High priority)
- Quebec (38% - Moderate priority)
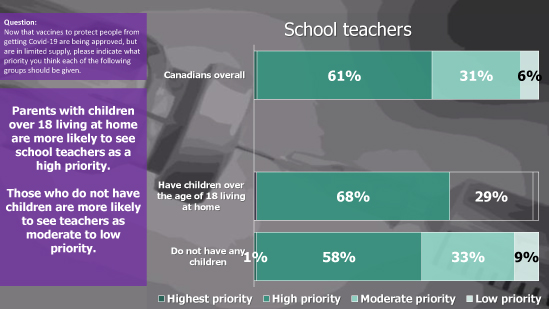
School teachers
Click the image to view a larger version
Parents with children over 18 living at home are more likely to see school teachers as a high priority.
Those who do not have children are more likely to see teachers as moderate to low priority.
Responses
- Canadians overall (61% - High priority)
- Have children over the age of 18 living at home (68% - High priority)
- Do not have any children (58% - High priority)
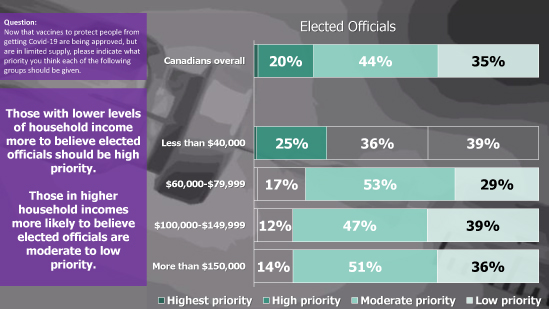
Elected Officials
Click the image to view a larger version
Those with lower levels of household income are more likely to believe elected officials should be high priority.
Those in higher household incomes more likely to believe elected officials are moderate to low priority.
Responses
- Canadians overall (20% - High priority)
- Less than $40,000 (25% - High priority)
- 60,000-$79,999 (53% - moderate priority)
- 100,000-$149,999 (47% - moderate priority)
- More than $150,000 (51% - moderate priority)
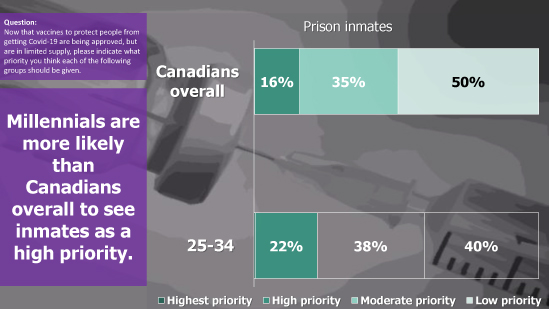
Prison inmates
Click the image to view a larger version
Millennials are more likely than Canadians overall to see inmates as a high priority.
Responses
- Canadians overall (50% - Low priority)
- Canadians overall (16% - High priority)
- 25-34 (22% - High priority)
Methodology

Click the image to view a larger version
- Conducted online with a demographically representative sample from panels of more than a million Canadians.
- N=1,001 adults (aged 18 and older) throughout the country.
- Survey conducted in English and French.
- Vector Research weighted the data in each region of the country to match the known demographic profile (age, gender, province) of the population in the census.
- Fieldwork: January 15 through 21, 2021.
- N/A for Online polls. With a pure probability sample of 1,001 one could say with 95% confidence that the overall results have a sampling error of plus or minus 3 percentage points where opinion is evenly divided. 
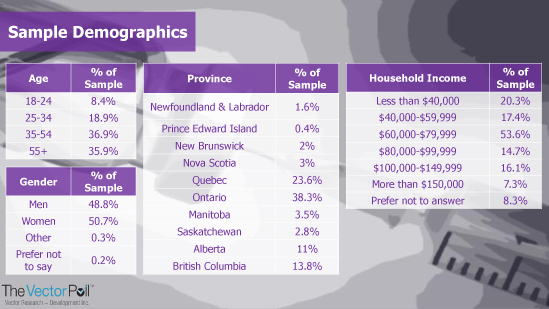
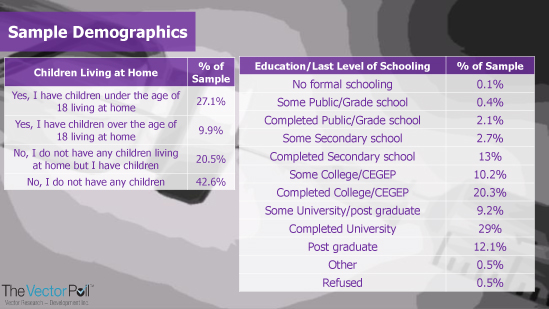
Sample Demographics
Click the image to view a larger version
Sample Demographics
Click the image to view a larger version
For More Information Please Contact
Marc Zwelling, President,
416-733-2320
Adrian Macaulay,
Research Associate
Adrian@vectorresearch.com
647-539-7587
< go back
Read more from The Vector Blog»

|